More transparency for sustainable product development
How and why are we calculating the CO₂ footprint of our products?
To help achieve the goals set out by the European Green Deal on climate neutrality by 2050 at the latest, the current emissions must first be calculated so that subsequent potential savings can be identified.
To make the greenhouse gas emissions of our products transparent throughout the entire supply chain, we have started to determine the carbon footprint of our products. We can then help our customers in gaining a comprehensive view of the company carbon footprint.
How do we calculate the carbon footprint?
Daniel Sperr and his colleagues are responsible for balancing the carbon footprint of uvex safety products. From the materials used to disposal: All information is collected and used to calculate the individual carbon footprint.
Downloads
CO₂ Footprint
To increase the transparency of our products' greenhouse gas emissions throughout the entire supply chain, uvex has started to calculate the carbon footprints of products. Discover more about the measurement methodology, and comparability of carbon footprints.
You can now see individual carbon footprints of selected uvex products in our CO2 footprint list. Providing this data makes our products measurable, comparable and improvable. Our figures are ISO accredited and supported by globally recognised frameworks.
Detailed description of our product carbon footprint methodology
Following ISO 14026 - the international norm for footprint communications - this section provides supporting information regarding our product carbon footprints.
To help achieve the goals set out by the European Green Deal on climate neutrality by 2050 at the latest, the current emissions must first be calculated so that subsequent potential savings can be identified. To determine transparency of our products' greenhouse gas emissions throughout the entire supply chain and to provide our customers with a comprehensive view of their company's carbon footprint, we calculate the products' CO2 footprints. uvex calculates the CO2 footprint of products using the measurement method specified in the ISO 140671 standard.
For independent verification of our measurement method and corresponding CO2 footprint calculation, we prepared a calculation report of the uvex 1 G2 planet safety shoe. The method was performed in accordance with ISO 14067 and the report has successfully passed a compliance audit. We chose the safety shoe for testing as it is our most comprehensive and complex product. All products are calculated in the same way as in this method.
Due to the inherent complexity and variability of PCF calculations, the carbon footprints calculated following our methodology are not intended to be directly compared to PCFs of other organisations.
1 The ISO 14067 standard is the basis for the procedure of developing a ‘Product Carbon Footprint’
On product level (e.g., T-Shirt), individual products may differ depending on gender, size/width or color. In line with EEB (2021)1, we base our calculations on a uniform size (see next table). Similarly, we calculate Footwear-PCFs for one width only. While we do not differentiate between sizes for unisex products (or products with uniform sizes), PCFs are calculated separately for men and women in case these products are sold in substantial volumes. Further, we do not differentiate between colours.
Representative product
Representative Product
Women*
Men
Uniform Size
Eyewear
x
Head
x
Gloves
9
Footwear
38
42
*for relevant products only.
1 EEB (2021). Draft Product Environmental Footprint Category Rules (PEFCR) Apparel And Footwear. Zugriff am 09.07.2024. Link: eeb.org/wp-content/uploads/2021/11/Draft-Product-Environmental-Footprint-Category-Rules-PEFCR-apparel-and-footwear.pdf
The system boundary defines which process are to be in- and excluded when conducting PCF calculations.
All relevant processes that a product goes through are taken into account for the calculation.
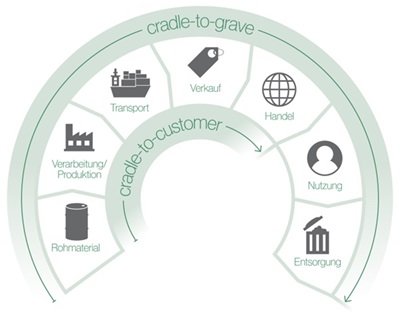
We distinguish between two principles:
cradle-to-customer: Calculation from raw material to customer.
cradle-to-grave: Includes the cradle-to-customer calculation and extends beyond the useful life to include disposal.
System Boundary
More specifically, the following table provides an overview of the system boundary of cradle-to-customer PCFs.
System Boundary of cradle-to-customer PCFs
Included
Excluded
✔ Raw Materials
✖ Wastewater Treatment*
✔ Auxiliary Products
✖ Employee Commuting**
✔ Energy Consumption
✖ Business Travel**
✔ Process Losses
✖ Packaging (Tertiary2)*
✔ Transportation (Raw Material to Final Customer)
✔ Packaging (Primary & Secondary1)
* no relevant impact ** not product-related
Additionally, cradle-to-grave PCFs include use phase emissions. This is only relevant for workwear, however (washing cycles). In line with EEB (2021)3, no use stage (e.g., for cleaning) is dedicated to footwear products. Further, cradle-to-grave PCFs include emissions that relate to the final waste treatment of the sold product.
For included processes (e.g., raw materials), we aim to include all data that relate to a product, i.e. to avoid omitting (=cutting-off) material or energy data. Therefore, if all data is readily available, no cut-off is applied. However, in some cases, the acquisition of data that is only of minor importance to the overall result would represent a disproportionately large effort. Even though we do not define a fixed cut-off percentage (e.g., 1% as used by the International EPD System (2021)4), the cut-off value will approximately be in this range. Depending on the process, the cut-off percentage refers to weight (i.e. materials) or GHG emissions (e.g., tap water).
According to ISO 140671, a functional (declared) unit is the reference unit for quantification of a (partial) PCF. This means that all data used to model the PCF relate to this unit.
For instance, to calculate electricity-related coating emissions of gloves, the factory’s total electricity consumption needs to be broken down to kWh consumed per pair of gloves (i.e. the functional unit).
Functional Unit
Aspect
Description
What?
Representative Product
How much?
For Products typically used in pairs (e.g. Gloves): Pair Otherwise: Single Product
How well?
Wear in good condition with appropriate use for the given product
How long?
A product's lifetime with appropriate use
1 The ISO 14067 standard is the basis for the procedure of developing a ‘Product Carbon Footprint’
Waste treatment is considered in two stages: Firstly, losses during manufacturing along the value chain are treated as waste in the country where they occur. Secondly, at the product’s end of life, final disposal is considered in the country, where the majority of the products is sold (default: Germany). To account for the emissions associated with waste disposal, we apply predefined waste scenarios available in our Life-Cycle-Assessment (LCA) software SimaPro1. These scenarios consider how – on average - different materials are disposed of in different countries (e.g., x% landfill, y% incineration, z% recycling for a certain material). Further, different material-specific emissions are taken into account with their specific disposal types (e.g., incinerating 1 kg of PUR has different emissions than incinerating 1 kg of paper). Thus, the overall waste emissions are specific to the product’s material composition and country where it gets disposed of.
1 SimaPro is a leading LCA software that allows organizations to analyze the environmental impact of their products or services.
If electricity is procured with accompanying contractual information (e.g., guarantees-of-origin) or own renewable energy plants are present, the specific (renewable) electricity mix is chosen. Otherwise, a country-specific grid mix is selected from the Ecoinvent1 database.
1 The Ecoinvent database is a comprehensive life cycle inventory (LCI) database which contains > 18.000 datasets containing industry-average emission data
Allocation refers to dividing environmental impacts between different products’ life cycles. This is necessary in case a process produces more than one product (=multifunctionality) or in case of recycling.
Allocation: Production Data
To attribute activity data from own operations or suppliers (e.g., energy/material consumption) to a single product, the relevant activity data is divided by the number of pieces produced – if possible by taking into account the varying energy/material intensity across product lines (e.g., different energy consumption for different glove types during coating).
Allocation: Cut-off (End-of-Life & Recycling)
When modeling the emissions of recycled materials, allocation is necessary. This necessity arises from the need to divide the environmental burdens between two interconnected life cycles: virgin vs. recycled material. Thus, it is necessary to define where one life cycle ends and where the other life cycle begins. To do so, we follow the simple cut-off-approach as described by Ekvall et al. (2020)1 (not to be confused with a cut-off percentage as discussed in the section dealing with our system boundary). Thus, the environmental burdens of virgin material production, recycling and waste disposal (E) are calculated as follows:
E=1-R1xEv+R1xEr+1-R2xEd
Where:
E = environmental burdens of virgin material production, recycling and waste disposal
R1 = share of recycled material in the product
R2 = rate of recycling of material after use in the product
Er = environmental burdens of the recycling activities that supply recycled material to the product.
Ev = environmental burden virgin material
Ed = environmental burden waste disposal
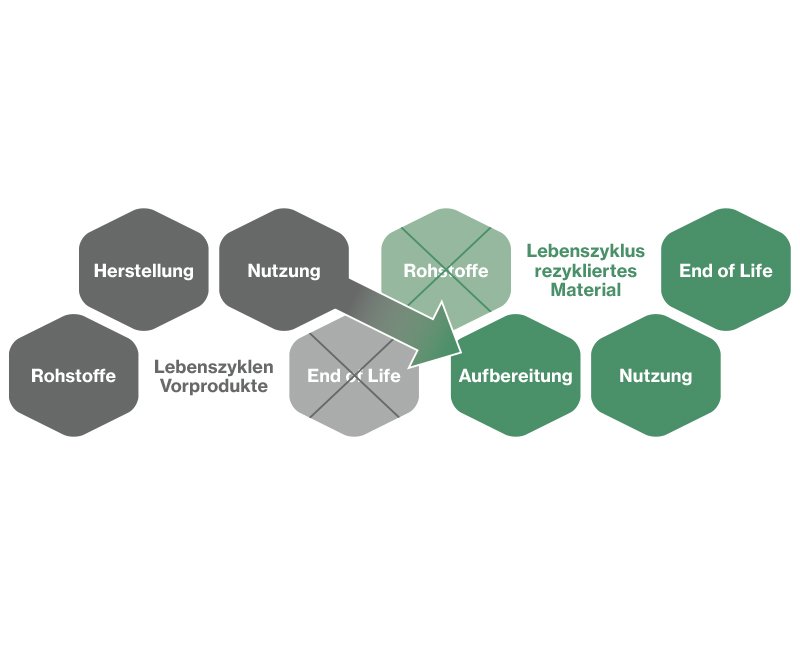
In words, the cut-off approach sets the boundary between two life cycles at the point where the waste material is collected for recycling. Therefore, recycling materials reduces the carbon footprint of both virgin material (by avoiding its end of life treatment) and recycled material (by avoiding raw material production) (see figure below). The life cycle of recycled material starts when the waste material is collected for recycling. Therefore, recycling processes should be included in the product where the recycled material is used.
Graphical representation of cut-off allocation for recycled materials
1 Ekvall, T., Albertsson, G. S., & Jelse, K. (2020). Modeling recycling in life cycle assessment.
When calculating PCFs, not only CO2 but also other greenhouse gases that are emitted along a product’s life cycle are considered. To better compare the different greenhouse gases, they are converted into CO2 emissions and presented together with the actual CO2 emissions as CO2 equivalents (CO2e). The conversion factors are currently taken fromIPCC 2021 GWP 100a1 (100-year time horizon Global Warming Potential) from the Intergovernmental Panel on Climate Change.
Following ISO 140672, all GHG emissions shall be calculated as if released at the beginning of the assessment period. In this line, biogenic carbon temporarily stored in products is omitted for both cradle-to-customer and cradle-to-grave PCFs. Further, we follow an attributional approach which, in broad terms, aims to estimate a product’s share of the global GHG emissions (Ekvall, 2019)3. Since this relates to emissions that have physically occurred, avoided emissions are not part of the PCF. This is also in line with the GHG Protocol (2011)4 which does not allow for a subtraction of avoided emissions. Similarly, offsets are excluded from the inventory (as demanded by both ISO 14067 and GHG Protocol).
Notably, all PCF results relate to their respective functional/declared unit and, as such, do not contain information regarding impacts on areas of protection (e.g., damage to ecosystems as a whole), the exceedance of thresholds (e.g., planetary boundaries) or other risks.
1 IPCC 2021 GWP 100a is a method of calculation in accordance with the latest research 2 The ISO 14067 standard is the basis for the procedure of developing a ‘Product Carbon Footprint’ 3 Ekvall, T. (2019). Attributional and consequential life cycle assessment. In Sustainability Assessment at the 21st century. IntechOpen. 4 GHG Protocol (2011). Product Life Cycle Accounting and Reporting Standard. Accessed 09.07.2024. Link: ghgprotocol.org/sites/default/files/standards/Product-Life-Cycle-Accounting-Reporting-Standard_041613.pdf
As data quality of emission factors and activity data is heterogenous, inventory data collection always involves evaluating data quality.
We prioritize data quality as follows:
Data Hierarchy
Rank
Data Type
Description
1
Primary (Site-Specific) Data
Data Specific to Own Value Chain
2
Secondary Data
Industry-Average Data
3
Proxy Data
Approximation Based on Similar Activities/Materials
Primary Data
To most accurately represent a given product system, site-specific data shall be prioritized. Following ISO 140671, this refers to data which are obtained from direct measurements within the product system. Thus, this includes measurements from our own plants and measurements reported to uvex by our suppliers. In our own plants, this includes recording waste figures, energy consumption and production figures. It is particularly important to know the individual production steps so that the carbon footprint can be represented as comprehensively as possible. Changes in the result are possible at any time if a general value is replaced by a supplier's more accurate value.
As these measurements mostly refer to energy consumption, generic GHG markups (relating to e.g., buildings, auxiliary materials) based on similar Ecoinvent2 datasets are added wherever possible. Given that calculation rules are not universally harmonized, site-specific data (especially emission factors) need to be treated with care. If data quality of emission factors must be questioned (e.g., due to implausibly high or low values), own re-calculations based on activity data are preferred. Notably, in case of multiple suppliers where data is available on different quality levels, the site-specific data with the highest quality is chosen and used as a proxy for the other suppliers. This way, suppliers delivering higher quality data (which may lead to higher emission factors) are not penalized.
Secondary Data
If site-specific data are not available or not plausible, secondary data derived from the Ecoinvent database are used. The values in the database are averages for common materials and cannot be broken down to a specific manufacturer's product. These are therefore only general values. Nevertheless, the database is ‘live’ and regular updates ensure that additional data is added or known data is adapted. This means that changes to the result are possible at any time.
If no matching dataset is available, emission factors from scientific studies or environmental product declarations (EPDs) are used. If emission factors relate to a precursor product only, subsequent production processes are accounted for, if possible (e.g., energy consumption from PAN to carbon fiber).
Proxy Data
In case the abovementioned steps did not yield an emission factor, the activity is either omitted (if irrelevant for the final result) or proxy data (approximation based on similar activities/materials) is used.
The following table depicts the data sources and hierarchy in greater detail:
Data Sources by Activity
Activity
Required Data
Data Source and Hierarchy
Materials
Material Emission Factors
1) Supplier Data*; 2) Ecoinvent; 3) Studies/EPDs
Materials
Weight of Product Components
Weighing or Calculation**
Manufacturing
Energy Consumption
1) Supplier Data*; 2) Ecoinvent
Manufacturing
Energy Emission Factors
1) Ecoinvent; 2) Federal Environment Agency (UBA)
Manufacturing
Auxiliary Materials Consumption
1) Supplier Data*; 2) Ecoinvent
Manufacturing
Auxiliary Materials Emission Factors
Ecoinvent
Manufacturing
Process Losses (%)
1) Internal Data or Supplier Data***; 2) Ecoinvent
Transport
Distance & Mode Inbound
EcotransIT
Transport
Distance & Mode Outbound
Default: 1000 km by Lorry
Transport
Transport Emission Factors
Ecoinvent
Sales
Fuel Consumption
Internal Fuel Data
Use
Washing Cycles
EEB (2021)3
Use
Emission Factors
Ecoinvent
End-of-Life
Disposal Emission Factors
Ecoinvent
End-of-Life
Disposal Mode
SimaPro Waste Scenario
*preferably own modeling based on supplier activity data **calculation e.g., for packaging materials that contain more than one product ***depending on value chain position of losses
Software
To calculate the CO2 footprint of a product, we use the SimaPro4 software package with the Ecoinvent database. This contains life cycle inventory data on energy, materials, transport etc. Using this software, various factors such as materials, production processes, transport routes and methods as well as a disposal process are selected and put together to form a total component. The result including background processes is now calculated using the data obtained.
1 The ISO 14067 standard is the basis for the procedure of developing a ‘Product Carbon Footprint’ 2 The Ecoinvent database is a comprehensive life cycle inventory (LCI) database which contains > 18.000 datasets containing industry-average emission data 3 EEB (2021). Draft Product Environmental Footprint Category Rules (PEFCR) Apparel And Footwear. Accessed 09.07.2024. Link: https://eeb.org/wp-content/uploads/2021/11/Draft-Product-Environmental-Footprint-Category-Rules-PEFCR-apparel-and-footwear.pdf 4 SimaPro is a leading LCA software that allows organizations to analyze the environmental impact of their products or services.
In our customer communication we use the cradle-to-customer calculation, as we currently have no influence on the disposal process and can only speculate about the waste scenario (CO2 emissions vary widely depending on this). Therefore, we only show the cradle-to-grave value on the results data sheets. These sheets contain all the important information, which can be used for presentation to the customer.
Results are grouped into the 6 categories i) Material, ii) Manufacturing, iii) Transport, iv) Packaging, v) Use (if applicable) and vi) Disposal. For each product category, the following table provides more detailed information on the emissions falling into each category:
Product Category
cradle-to-grave
cradle-to-customer
Use
Disposal
Material
Manufacturing
Transport
Packaging
Eyewear/Visor
Materials used in different Components (e.g., Polycarbonate Granulate)
Processing of Materials to Produce Components (e.g., Injection Moulding of Polycarbonate) & Waste Treatment of Losses
Transport of i) raw material/components to final manufacturing site ii) final product to customer (incl. sales markup depending on product category)
Production and Transport of Primary and Secondary Packaging Material
Fibres and other Materials (e.g., Steel for Eyelet)
Further Processing of Fibres (Spinning, Knitting, Weaving, etc.), of other Materials (e.g., Forming of Hook) & Waste Treatment of Losses
Washing
Swedsafe
Plug Materials, Consumables during Manufacturing (e.g, Mould), Components (e.g., Cord)
Plug Manufacturing & Waste Treatment of Losses
not relevant
Respiratory Protection
Materials used in different Components
Energy Consumption of Tier 1 & 2 Supplier & Waste Treatment of Losses
Emissions Grouping by Product Category
Important: Calculation methods are constantly revised and subject to change. It is possible that a different method may be used to evaluate our calculation at any time and that different results will be obtained from the same calculations. It is therefore important to include the method used and the calculation date in the communication.
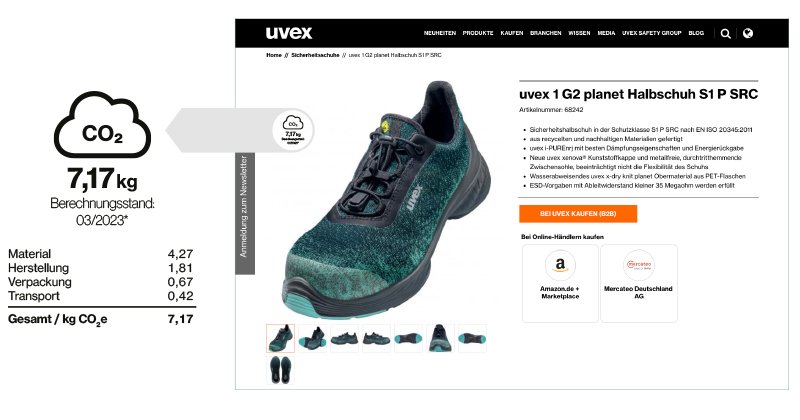
Presentation on the uvex website
The presentation of the result on the website will appear as follows. For support and more detailed data, the results data sheet can be used for communication with the customer.
Presentation of PCF on uvex website
When displayed on the uvex website, values for each category are rounded to 2 (3 for plugs) decimals and the rounded values per category are summed up to arrive at a cradle-to-customer value. To avoid rounding deviations, also PCF results communicated via results data sheets are rounded in the same way.
ISO 14026 describes the requirements for PCF communication. General communication requirements include (among others) stating the life cycle stages included and reassessing the PCF in case of changes to calculation methodology, product or manufacturing processes. Further, footprint communications shall not imply a general “environmental friendliness” as the PCF looks at greenhouse gas emissions only. Business-to-Consumer communication further requires to 1) provide supporting information and explanatory statements to facilitate consumer understanding, 2) clearly state where supporting information can be found and 3) publish information on how the consumer can reach out to uvex.
Supporting Information (=this document) refers to a report in line with ISO 14044:2006, 5.2 that includes details relating to goal, scope, life cycle inventory, impact assessment, analysis and critical review (if applicable). It shall be easily accessible and free of charge (e.g., web link).
Explanatory statements are short statements that shall ensure that the footprint is not misunderstood. They can refer to the supporting information. To account for that, the following sentence is accompanying every footprint communication: “Legal notice regarding carbon footprint: Calculation method: IPCC XXX1 GWP 100a (based on ISO 14067) SimaPro XXX ecoinvent database XXX. Scope: cradle-to-customer. These CO2 values are valid at the time of calculation and may be subject to change. More information can be found at uvex-safety.com/carbon-footprint”
In theory, comparative footprint communications can be made a) on another organization’s product or b) on an organization’s own product.
For all comparative communications, quantitative information and an explanatory statement are mandatory. Further, all relevant (and the same) stages of the life cycle need to be taken into consideration by all footprints used for comparison. Different products shall only be compared if the PCFs follow the same calculation and communication rules.
A comparison with products of other organizations is only allowed if the basis is either i) a single underlying comparative footprint study that has undergone a critical review in accordance with ISO/TS 14071 and covers the footprints of all products to be compared or if ii) the footprints have been determined by different footprint studies that have undergone a critical review according to the requirements of the same footprint communication program, following the same product category rule (PCR)1 (developed in accordance with ISO/TS 14027), given that the footprints compared are based on consistent data (e.g., same databases).
As these conditions are currently not fulfilled, our PCF results cannot be compared with PCFs of other organizations (see table)
Requirements for comparisons with products of other organizations (ISO 14026; 6.9.3)
Options
Requirements
Comment
Option A: PCFs from single comparative study
Single underlying comparative footprint study (of all footprints compared) that has undergone a critical review in accordance with ISO/TS 14071
not done: would require joint study with other companies
Option B: PCFs from different studies
Critical Review acc. to same PCR & footprint communication program
not done: costly, time-consuming & for many products there is no PCR available
Consistent data
difficult: different studies and databases used across companies
No Comparison with products of other organizations possible
When the comparison of a product’s footprint with itself over time (performance tracking) is communicated, the main factors contributing to changes of the footprint need to be stated. Communication of performance tracking can be done when changes in the footprint occurred through, e.g., improvements of own/supplier production processes, change of suppliers, improved eco-design, etc.
1 PCRs foster comparability by ensuring an a) identical functional unit, b) identical criteria for inclusion of inputs/outputs, c) equivalent system boundaries and data description, d) same data quality requirements, e) identical life cycle inventory units and calculation procedures, f) equivalent allocation rules, g) identical impact categories and characterization factors and h) equivalent footprint communications (format, content)